Chapter 7
Moving Averages --- Your First Real Tool
By the first week of December, Rohan's TradingView chart looked like a circuit board.
He had added, over the previous two weeks, nine indicators: RSI, MACD, Bollinger Bands, two moving averages, a volume oscillator, Stochastic RSI, Average True Range, and something called the Ichimoku Cloud, which he had added because a comment on a YouTube video had described it as "the most powerful indicator in existence."
The price chart itself was barely visible beneath all of it. The main panel had four overlapping lines of different colours crossing each other at irregular intervals. Below it there were three sub-panels of histograms and oscillators, each with its own scale and rhythm, each apparently independent of the others.
He had stared at this chart for forty minutes and could not tell, with any confidence, whether the price of the stock was going up, down, or sideways.
He took a screenshot of it and sent it to Meera.
She replied in thirty seconds: This is a cry for help.
He brought the screenshot to KM Sir on Sunday.
KM Sir looked at it for a moment. He picked up his filter coffee. He set it down without drinking it. He picked up his notebook, read yesterday's line, and set it down.
*A lagging tool that confirms is worth more than a leading tool that guesses.*
"How many of these indicators do you understand?" KM Sir asked.
Rohan considered being honest. He was honest. "Two. Maybe."
"Remove the ones you do not understand."
He removed seven indicators. The chart became readable.
The two he kept were the 20-period EMA and the 50-period EMA. He had added these after reading about moving averages and had some grasp of what they showed him, even if he could not yet explain it precisely.
Moving averages, KM Sir explained, were the simplest and most durable tool in technical analysis. Their logic was also their limitation, and understanding both was necessary.
A moving average calculated the average closing price over a specified number of periods. A 20-period moving average added the last twenty closing prices and divided by twenty. As each new candle closed, the average moved forward, dropping the oldest price and including the newest. The result was a smooth line on the chart that showed the average direction of price over that period.
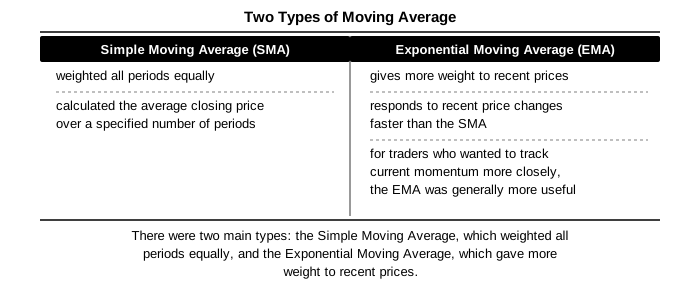
There were two main types: the Simple Moving Average, which weighted all periods equally, and the Exponential Moving Average, which gave more weight to recent prices. The EMA responded to recent price changes faster than the SMA. For traders who wanted to track current momentum more closely, the EMA was generally more useful.
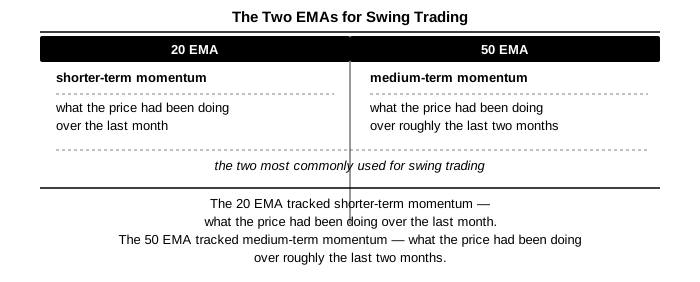
The two most commonly used for swing trading were the 20 EMA and the 50 EMA. The 20 EMA tracked shorter-term momentum --- what the price had been doing over the last month. The 50 EMA tracked medium-term momentum --- what the price had been doing over roughly the last two months.
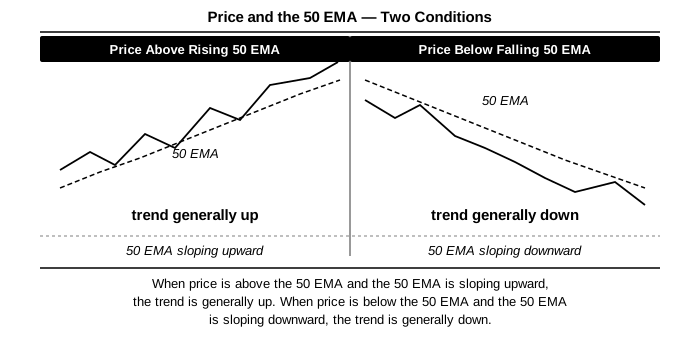
"When price is above the 50 EMA and the 50 EMA is sloping upward, the trend is generally up," KM Sir said. "When price is below the 50 EMA and the 50 EMA is sloping downward, the trend is generally down. This is a simple statement and it is approximately correct in trending markets."
"Approximately?"
"Moving averages lag. They tell you what has happened, not what will happen. By definition, the 50 EMA includes data from fifty periods ago. By the time the 50 EMA has confirmed a new uptrend, the price has already moved significantly in that direction. You are paying for confirmation with some of the move."
Meera had asked the right question before Rohan could ask it himself. When he relayed it to KM Sir that afternoon --- if it lags, why use it? --- KM Sir gave the answer that changed how Rohan thought about tools in general.
"Because a lagging tool that confirms is worth more than a leading tool that guesses," he said. "You can find many indicators that claim to predict where price will go. In my experience, most of them are coincidences in historical data. A moving average does not claim to predict. It confirms. It says: this has been the direction of price for this period. Is this consistent with the trade you are considering?"
"So it's not a signal. It's context."
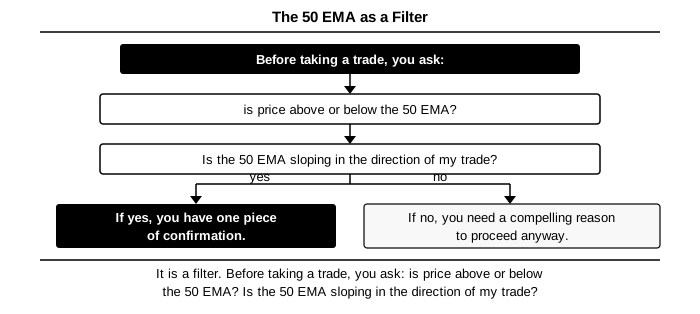
"It is a filter. Before taking a trade, you ask: is price above or below the 50 EMA? Is the 50 EMA sloping in the direction of my trade? If yes, you have one piece of confirmation. If no, you need a compelling reason to proceed anyway."
Rohan thought about the nine trades he had lost in the downtrend the previous month. He pulled up the chart mentally: price below the 50 EMA, the 50 EMA sloping downward. He had bought anyway.
"I would have failed the filter on all nine," he said.
"Yes."
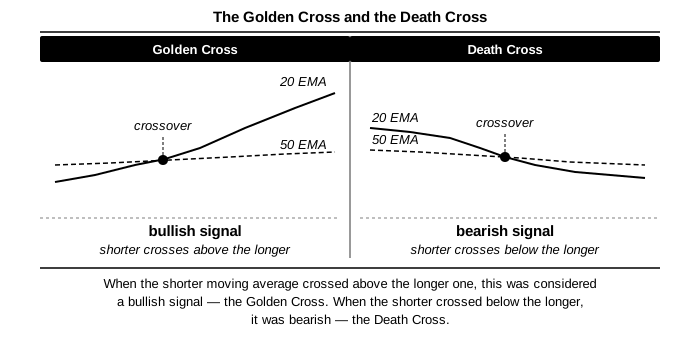
There was a concept connected to moving averages that KM Sir mentioned but did not dwell on: the Golden Cross and the Death Cross. When the shorter moving average crossed above the longer one, this was considered a bullish signal --- the Golden Cross. When the shorter crossed below the longer, it was bearish --- the Death Cross.
These signals were well known and, as a result, had mixed effectiveness. Because many traders acted on Golden Cross signals, the signal itself could become self-fulfilling: the price moved up because everyone who watched for it bought. It could also fail entirely when the cross occurred during a sideways, choppy market.
"These crossovers are worth knowing," KM Sir said. "They are not worth trading mechanically. They are one piece of information, not a complete system."
Rohan wrote this down. He had noticed, over the previous weeks, that KM Sir never presented any concept as a complete system. Every tool had a context in which it worked and a context in which it failed. Every rule had a condition attached to it. This was initially frustrating. He had come to KM Sir looking for rules. He was beginning to understand that the rules were always conditional.
He removed seven of the nine indicators and kept only the two EMAs. The chart was clean. He could see the price, the two moving averages, and the volume panel.
He could see, on the current chart in front of him, that the 50 EMA was beginning to slope upward for the first time in six weeks. The price was approaching it from below.
He did not place a trade. He had learned enough by now to know that one condition was not a reason. He needed more before he entered.
What more, exactly, was the subject of the following Sunday.
The filter coffee that KM Sir had placed on the table at the beginning of the session sat untouched beside him until the end. He had not noticed it go cold. Rohan had watched it happen over two hours and had said nothing.
He did not know why this detail stayed with him. It stayed with him for years.
The reason he had added nine indicators before understanding what any of them did was the same reason most retail traders made the same mistake: he had been looking for certainty.
Each indicator had promised to show him something the price alone could not show. RSI promised to show when something was overbought or oversold. Bollinger Bands promised to show volatility. Stochastic promised to show momentum. The Ichimoku Cloud --- the most complex of the nine --- had promised, according to the YouTube comment, to show trend direction, momentum, support, resistance, and signal timing all at once.
The problem was that each of these promises was conditional. RSI above seventy was overbought --- in a ranging market. In a strong uptrend, RSI above seventy often stayed above seventy for weeks. Bollinger Bands narrowing indicated low volatility and the likelihood of expansion --- but not the direction of expansion. Every indicator that promised to tell him what was coming was, under scrutiny, telling him something about what had happened and leaving the future to him.
He had added nine indicators because he thought more information would produce more certainty. He had produced more noise.
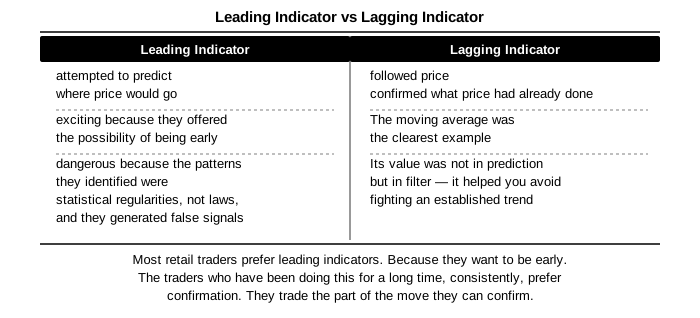
Two indicators, understood well and used in the right context, were worth more than nine indicators understood poorly.
KM Sir spent part of that Sunday on a concept Rohan had not heard before: the difference between a leading indicator and a lagging indicator.
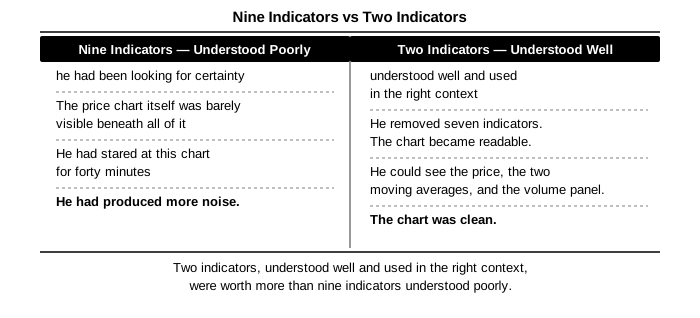
A leading indicator attempted to predict where price would go. By definition, a leading indicator had to be based on something other than price --- or on price behaviour patterns that had historically preceded a move. Leading indicators were exciting because they offered the possibility of being early. They were dangerous because the patterns they identified were statistical regularities, not laws, and they generated false signals.
A lagging indicator followed price. It confirmed what price had already done. It told you that a move had occurred with enough force and duration to register in its calculation. The moving average was the clearest example: it could only tell you a trend was established after the trend had already established itself. Its value was not in prediction but in filter --- it helped you avoid fighting an established trend.
"Most retail traders prefer leading indicators," KM Sir said. "Because they want to be early. They want to buy the bottom and sell the top. They think this is possible consistently. It is not. The traders who have been doing this for a long time, consistently, prefer confirmation. They accept that they will miss the first part of a move. They trade the part of the move they can confirm."
This was the underlying principle of Rohan's system. Not to predict. To confirm and then follow.
He asked KM Sir about a question he had been sitting with for a week: was there a perfect number of indicators?
KM Sir thought about it in the way he thought about most things --- without hurrying, without giving the impression that the answer was on the way.
"There is a number that is too many," he said. "There is a number that is enough. They are different numbers for different traders and different methods. What I can tell you is the principle: every indicator you add must answer a question that your existing setup cannot answer. If you already know the trend direction, and you already have a signal, and you already have volume confirmation, what does a fourth indicator add? If the answer is nothing, do not add it."
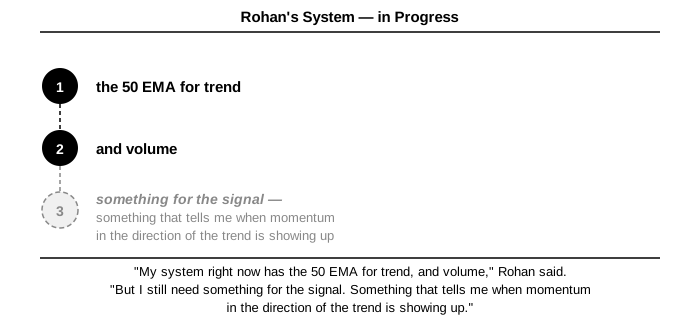
"My system right now has the 50 EMA for trend, and volume," Rohan said. "But I still need something for the signal. Something that tells me when momentum in the direction of the trend is showing up."
KM Sir nodded. This was the question that led to the following chapter.
The MACD was the answer --- a momentum indicator built from moving averages, designed precisely to show when shorter-term momentum was aligning with a longer-term trend. Rohan did not know this yet. He left the Sunday session with the question unresolved but with a clearer sense of what he was looking for: not another filter, not another confirmation. A signal. Something that told him when to act within the conditions the trend and volume had already established.
He spent the week looking for it. He found it on Thursday evening, in a description of the MACD that finally explained not just what it showed but why it worked. He read the description three times. On Friday morning he added the MACD to his chart and removed the other seven indicators.
The chart was readable again. The MACD panel below the price told him what the relative position of two EMAs was saying about current momentum. He sat with this for a day before building anything from it.
Saturday morning, before 6am, he opened his notebook.