Chapter 5
Volume --- The Truth Behind the Price
On a Thursday in the second week of November, Rohan placed his first trade using what he had learned.
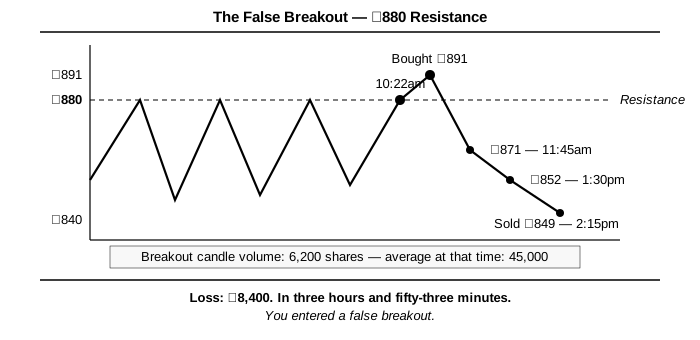
He had been watching a stock in the Nifty Midcap 100 --- a mid-size infrastructure company --- for four days. The stock had been range-bound between ₹840 and ₹880 for the last two weeks. He had drawn the resistance at ₹880. The stock had touched it four times without breaking through.
On Thursday morning, at 10:22am, the stock opened at ₹882 and moved to ₹889 in the first two candles. The price had broken above the resistance level he had drawn.
He knew what this was. He had studied this pattern. A breakout above resistance. The previous resistance becomes the new support. The price should continue higher.
He bought sixty shares at ₹891.
By 11:45am the stock was at ₹871.
By 1:30pm it was at ₹852.
He sold it at ₹849 at 2:15pm.
Loss: ₹8,400. In three hours and fifty-three minutes.
He went back to the chart that evening and looked at what had happened.
The breakout had occurred at 10:22am. The candle that broke above ₹880 had a small body and a long upper shadow, which he now knew was not a strong signal. He had missed this. He had been looking at the price level, not the candle.
But there was something else on the chart he had been ignoring entirely. Below the price chart, there was a panel of vertical bars. He had always known it was there. He had never looked at it properly. It was the volume panel.
He looked at it now.
The breakout candle at 10:22am had the lowest volume of any candle in the last two hours. The average volume for this stock at that time of day was approximately 45,000 shares per candle. The breakout candle had traded 6,200 shares.
He went back to the chart and looked at the chart again.
He went back to the chart and looked at the volume bars the way KM Sir had taught him to look at the price: as information, not noise.
He had been staring at charts for six weeks and this was the first time he had actually looked at the volume.
On Sunday, before he could explain what had happened, KM Sir had already seen it.
"Show me the trade," KM Sir said.
Rohan pulled up the chart on his laptop. KM Sir looked at it for fifteen seconds. He opened his notebook, read yesterday's line, set it down.
*Price is the story. Volume is the evidence.*
"The breakout happened on what volume?" KM Sir asked.
"6,200 shares."
"And the average volume for that candle period?"
"Around 45,000."
KM Sir sat back. "So the price broke through the resistance level on fourteen percent of normal volume."
"Yes."
"And you entered."
"Yes."
KM Sir said nothing for a moment.
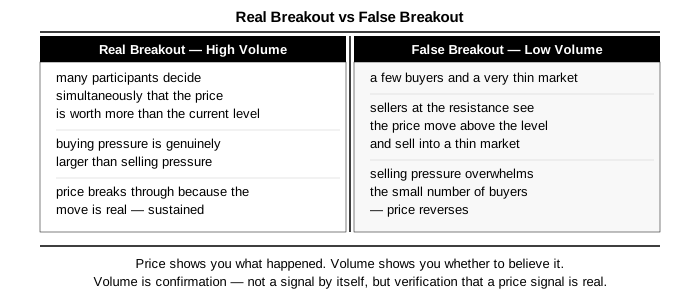
"Here is what the volume was telling you," he said. "A real breakout --- one that will hold --- happens when a large number of participants decide simultaneously that the price is worth more than the current level. That decision shows up in volume. Many sellers at the resistance level suddenly become outnumbered by buyers who are willing to pay above that level. The price breaks through because the buying pressure is genuinely larger than the selling pressure."
"When the price breaks through on low volume, what happened?"
Rohan thought about it. "Not many buyers. Not many sellers. A small number of transactions pushed the price above the level."
"Exactly. A few buyers and a very thin market. When the sellers at the resistance --- the ones who have been waiting to exit their losing positions at breakeven --- when they see the price move above the level, some of them sell. Into a thin market, that selling pressure overwhelms the small number of buyers. The price reverses."
"That's what happened," Rohan said.
"Yes. You entered a false breakout."
Volume, KM Sir explained, was confirmation. Not a signal by itself, but the verification that a price signal was real.
The principle was this: price shows you what happened. Volume shows you whether to believe it.
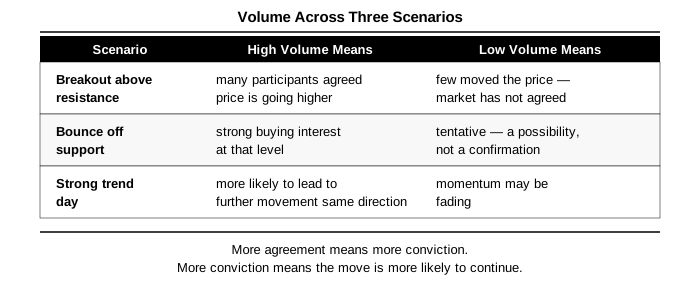
A breakout on high volume meant many participants agreed the price was going higher. A breakout on low volume meant a few participants moved the price, and the broader market had not yet agreed. The breakout on low volume was often followed by a return to the previous range --- exactly what Rohan had experienced.
The same principle applied to reversals. A bounce off a support level on high volume meant strong buying interest. A bounce on low volume was tentative --- a possibility, not a confirmation.
And it applied to trend continuation. A strong trend day on high volume was more likely to lead to further movement in the same direction. A strong trend day on declining volume suggested the momentum might be fading.
"Volume does not tell you where price will go," KM Sir said. "Nothing tells you that. Volume tells you how many people agree with what price is currently doing. More agreement means more conviction. More conviction means the move is more likely to continue."
There was one more thing KM Sir added, which Rohan had not expected.
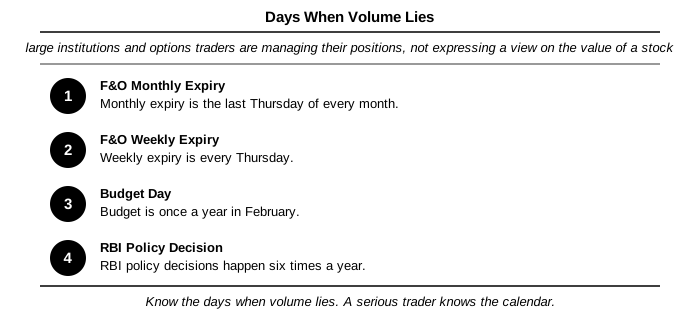
"There are days when volume is always high and means very little," he said. "F&O expiry days. Budget day. The day the RBI announces its rate decision. These are days when large institutions and options traders are managing their positions, not expressing a view on the value of a stock. Volume on these days is noise."
"How do you know which days to ignore?"
"You keep a calendar. Monthly expiry is the last Thursday of every month. Weekly expiry is every Thursday. Budget is once a year in February. RBI policy decisions happen six times a year. These are not complicated to track. A serious trader knows the calendar."
He wrote this in his notebook: Know the days when volume lies.
Below it, he wrote: Volume is context. Price is content. You need both.
He thought about the ₹8,400 he had lost on the false breakout. He had entered because the price had crossed a level. He had not asked why it had crossed, or how many people had agreed with the crossing.
The trade had been, from the beginning, a guess. The chart had not confirmed what he thought it was saying. He had not known to look for confirmation.
Now he knew. The knowledge had cost ₹8,400, which was the price he had paid to understand that price and volume were not two separate things but one thing --- the same story told in two languages, and you needed both languages to understand it.
The thing he had not understood about the false breakout, when it happened, was that he had had access to the information that would have prevented it. The volume data was on the chart. It had been on the chart the entire time. He had simply never looked at it.
This was the pattern he had been noticing since he started working with KM Sir. Every mistake he had made had been made in the presence of the information that would have corrected it. The trend had been visible in the price. The significance of the level had been visible. The volume confirmation had been visible. He had not known to look.
Trading education that focused only on what signal to look for, without teaching the question of how to verify that signal, was half an education. He had been trading with half an education.
KM Sir introduced a concept that week that Rohan would return to for years: the difference between a signal and a confirmation.
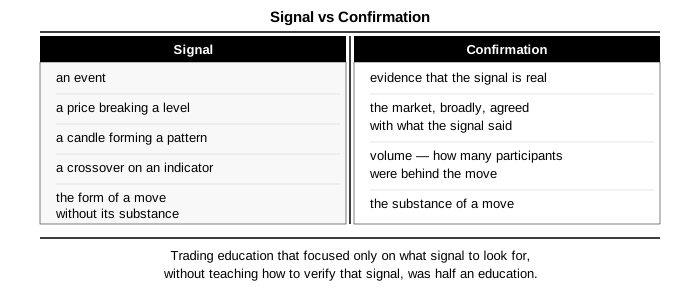
A signal was an event --- a price breaking a level, a candle forming a pattern, a crossover on an indicator. A confirmation was evidence that the signal was real --- that the market, broadly, agreed with what the signal appeared to be saying.
Volume was the most direct confirmation available. It showed how many participants were behind a move. A breakout that forty thousand traders participated in was more likely to be real than a breakout that six thousand traders participated in, because the forty thousand included institutional participants whose volume was harder to manipulate and who had, by definition, put significant capital behind their conviction.
"You cannot add volume to a move that does not have it," KM Sir said. "You can describe a low-volume move as a breakout. You can believe it is a breakout. But if the volume is not there, the participation that creates a sustained move is not there. You are seeing the form of a breakout without its substance."
The most expensive lesson in trading, Rohan was learning, was not the one that cost the most money. It was the one that was right in front of you the entire time.
He went back to every losing trade from the previous two months and added the volume data.
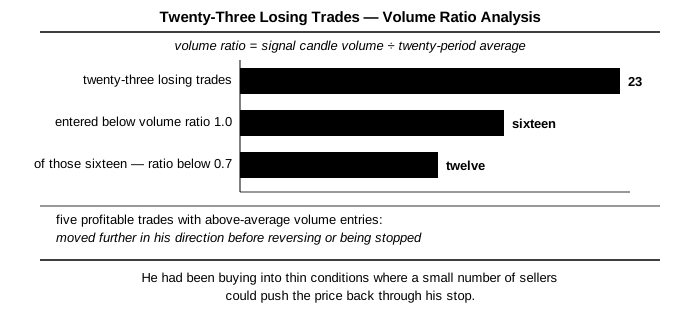
He built a simple column in his spreadsheet: volume on the signal candle compared to the twenty-period average. He expressed it as a ratio. A ratio above one meant above-average volume. Below one meant below-average.
Of his twenty-three losing trades, sixteen had entered on volume ratios below one. Twelve of those sixteen had volume ratios below 0.7 --- less than seventy percent of average volume.
He looked at this data for a long time.
Sixteen of his twenty-three losses had low volume entries. He had been entering trades where the market, in aggregate, was not participating. He had been buying into thin conditions where a small number of sellers could push the price back through his stop.
The five profitable trades that had above-average volume entries had, on average, moved further in his direction before reversing or being stopped. The profitable trades with below-average volume had been smaller winners.
"Volume is the wind behind the move," KM Sir said when he showed him this analysis. "You can sail without wind. But you will go faster and further with it. And in a falling market, without wind, you will go backwards."
He added volume to his pre-trade checklist that week. Not as a final rule --- the system was still being built --- but as a requirement:
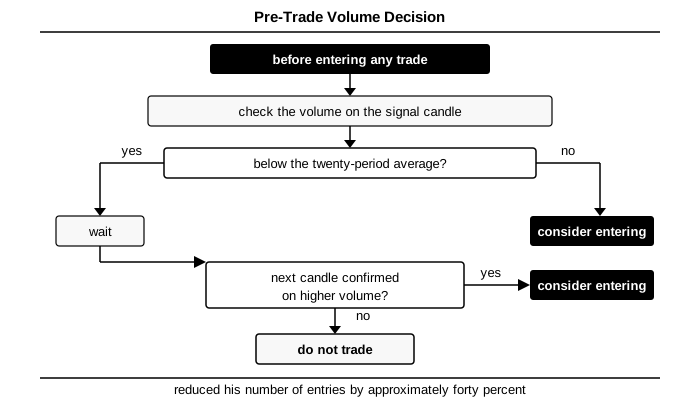 before entering any trade, he would check the volume on the signal
candle. If it was below the twenty-period average, he would wait. If the
next candle confirmed the move on higher volume, he would consider
entering. If the volume never appeared, he would not trade.
before entering any trade, he would check the volume on the signal
candle. If it was below the twenty-period average, he would wait. If the
next candle confirmed the move on higher volume, he would consider
entering. If the volume never appeared, he would not trade.
This one addition, applied consistently over the following three weeks, reduced his number of entries by approximately forty percent. It did not reduce his profitable trades by the same proportion.