Candlesticks --- One Candle, One Story
The first time Rohan watched a candlestick form in real time, he wasn't on any trading floor --- just at his desk in Andheri, laptop open, Kite loaded, the Nifty 50 fifteen-minute chart on one half of his screen and his work code on the other.
It was 9:17am on a Tuesday in November. The first candle of the day was forming. He watched the price tick up, tick down, tick up again. The candle body grew, red for a moment, then green, then red again. At 9:30am the candle closed. The body was small. Both the upper and lower shadows were long. The price had moved a lot in both directions during those fifteen minutes, but the close ended up almost exactly where the open had been.
He didn't know what this meant. He knew it was called a doji --- he'd read the word in three different places. He didn't know what to do with it.
That week, on a colleague's recommendation, he bought a well-known book on Japanese candlestick charting. It was 330 pages long and covered forty-seven distinct candlestick patterns, each with a name, a diagram, and a description of what it predicted.
He read it over four evenings. He highlighted sections. He made notes in the margin. He built a reference table in his notebook with the pattern names and what they meant.
By the end of the week he was more confused than before.
The problem wasn't that the patterns were complicated. The problem was that there were forty-seven of them, each with its own conditions, exceptions, and caveats about market context and confirmation. Morning Star, Evening Star, Abandoned Baby, Deliberation, Advance Block, Stalled Pattern, Three White Soldiers, Three Black Crows. He learned, for instance, that a Bullish Engulfing was a bullish reversal signal --- but only at the bottom of a downtrend, only when the second candle fully engulfed the first, and only when confirmed by the next session. He also learned that a Dark Cloud Cover was a bearish reversal signal, with different but equally fiddly conditions.
He could spot patterns in past charts with some confidence. In real time, with money on the line, he could spot nothing. The candle was still forming. It might turn into an Engulfing. It might become a Doji. It might close and become neither.
He threw the book at his couch. Not hard. But he threw it.
He asked Meera if she had read any candlestick books.
"I tried," she said. "I got to twenty-three patterns and gave up. I use three."
"Only three?"
"What's the difference between a small body and a doji?" she asked. "I've never been able to see it in real time."
He didn't know the exact answer. He wrote the question in his notebook.
He asked KM Sir on Sunday.
KM Sir looked at the question in Rohan's notebook. He picked up his own notebook, read yesterday's line, and set it down.
*A candle tells you who won a battle. It does not tell you who will win the war.*
"How many patterns are in that book?" KM Sir asked.
"Forty-seven."
"How many do you need?"
Rohan thought about it. "Three?" he guessed, remembering what Meera had said.
"Three is correct. And the difference between a small body and a doji is this: in a doji, the open and close are at or very near the same price. The battle ended in a draw. In a small body, one side won --- but only by a small margin. The distinction matters less on its own, and more in context."
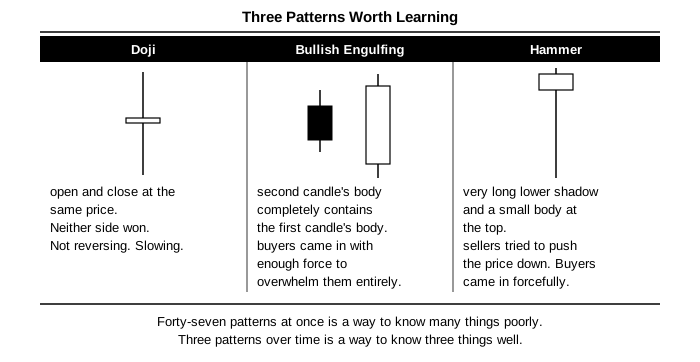
The three patterns KM Sir considered worth learning for a beginner were these.
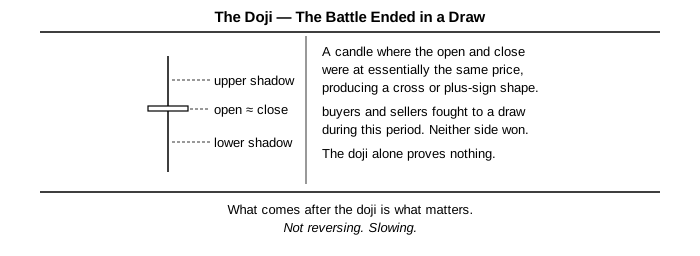
The first was the Doji. A candle where the open and close land at essentially the same price, forming a cross or plus-sign shape. What it tells you: buyers and sellers fought to a draw during this period. Neither side won. When a doji shows up after a strong move --- up or down --- it suggests the momentum behind that move may be slowing. Not reversing. Slowing. The doji alone proves nothing. What happens after the doji is what matters.
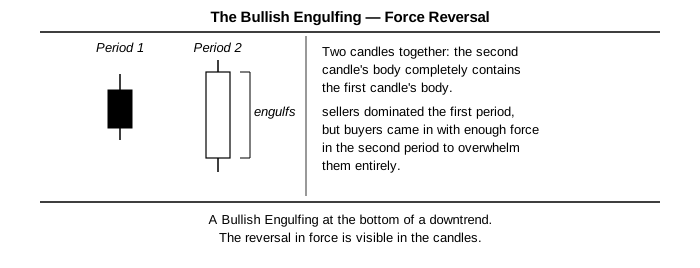
The second was the Engulfing candle. Two candles together: the second candle's body completely covers the first candle's body. A Bullish Engulfing at the bottom of a downtrend --- a small red candle followed by a larger green candle that swallows it whole --- tells you sellers dominated the first period, but buyers came in with enough force in the second period to overwhelm them completely. The reversal in strength is right there in the candles.
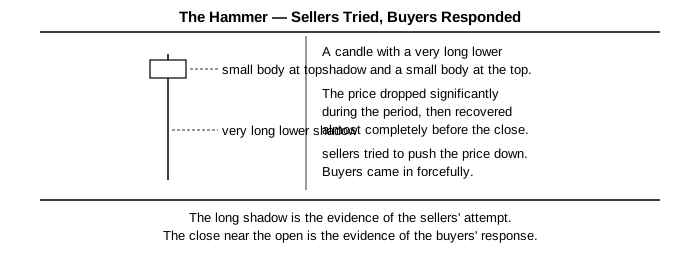
The third was the Hammer. A candle with a very long lower shadow and a small body near the top. The price dropped hard during the period, then recovered almost all of it before the close. What this tells you: sellers tried to push the price down. Buyers came in forcefully at the lower price and pushed it back up. The long shadow is proof of the sellers' attempt. The close near the open is proof of the buyers' response.
"These three tell you enough to start reading price in context," KM Sir said. "The other forty-four exist. Some are useful. But you won't be able to use them well until you understand these three so thoroughly that you no longer have to think about them. That takes time. Forty-seven patterns at once is a way to know many things poorly. Three patterns over time is a way to know three things well."
The question Meera had asked --- the difference between a small body and a doji --- turned out to have a practical answer more important than the technical one.
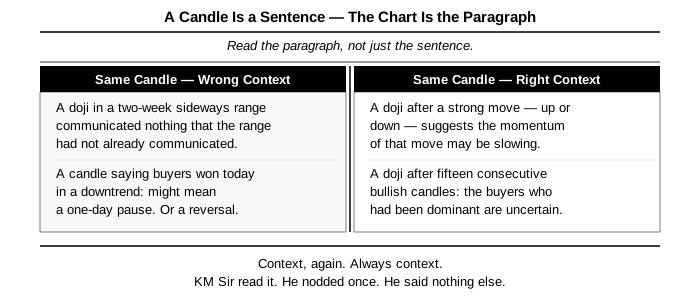
In real time, the exact distinction often mattered less than the context. A doji after fifteen straight bullish candles said something different from a doji in the middle of a sideways range. A small body after a large engulfing candle said something different from a small body on its own. The shape of the candle was one piece of information. The price action around it was the rest.
The forty-seven-pattern book had, without meaning to, taught Rohan to look at each candle in isolation. What KM Sir was teaching him was to read each candle as part of a conversation --- one line in a longer exchange between buyers and sellers.
A candle that said "buyers won today" meant something different if the previous ten candles had shown sellers winning steadily. It might be the first sign of a reversal. It might be a one-day pause in a downtrend. The candle alone couldn't tell you which.
He closed the browser tab with the forty-seven patterns and never reopened it.
He kept the tab with the three patterns. He printed the page and pinned it above his monitor at home, where it stayed until he moved out of the Malad flat three years later --- by which point he no longer needed it.
He spent the following week looking at daily charts with only the three patterns as his filter. Every morning he checked the Nifty 50 daily chart for any of the three patterns in the last ten candles, and noted what price did afterward.
The pattern that showed up most was the Doji. The ones that appeared after strong directional moves --- after price had run cleanly in one direction for several days --- were often followed by a slowdown or a reversal. The ones that appeared in choppy, sideways action were followed by nothing much at all.
Context, again. Always context.
He wrote in his notebook: A candle is a sentence. The chart is the paragraph. Read the paragraph, not just the sentence.
He didn't know if KM Sir would agree. He asked at the next Sunday meeting.
KM Sir read it. He nodded once. He said nothing else.
Rohan would learn, over the coming months, that this was KM Sir's highest form of approval.
The real problem with candlestick patterns wasn't learning them. It was learning to ignore the wrong ones.
In the third week of December, Rohan watched three doji candles form on three different stocks in a single afternoon. He identified all three correctly. He had no idea what to do with any of them.
A doji signaling indecision was only useful if the indecision at that specific moment, in that specific context, actually meant something. A doji after a strong twelve-session uptrend meant one thing: the buyers who had dominated for twelve sessions were, right now, uncertain. That was meaningful. A doji in the middle of a two-week sideways range said nothing the range hadn't already said. It was indecision layered on top of indecision.
He brought this problem to KM Sir, who answered with a question instead of an answer.
"Before you look at the candle," KM Sir said, "what should you already know?"
Rohan thought about the framework he had been building. "The trend. The direction the market has been moving."
"Yes. And?"
He thought further. "Whether price is at a significant level."
"Yes. So if you know the trend and you know the level, what does the candlestick pattern add?"
He understood. "Confirmation. The candlestick pattern tells you what happened at the level, within the context of the trend."
"Exactly. A hammer at a support level in an uptrend is three things agreeing at once: the trend is up, the level has historical weight, and buyers showed up forcefully right at that level. That's a meaningful combination. A hammer in the middle of a range, with no significant level nearby, is a hammer in a vacuum. It adds nothing."
The three-pattern framework gave Rohan a specific way to look at charts that he hadn't had before.
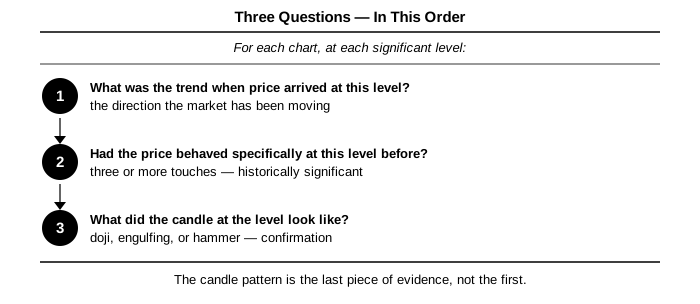
For each chart, at each significant level, he asked three questions in order. First: what was the trend when price reached this level? Second: had price behaved in a specific way at this level before? Third: what did the candle at the level look like?
If he couldn't answer the first two questions clearly, the third didn't matter. The candle pattern was the last piece of evidence, not the first.
He spent a week going through Nifty 50 daily charts from the previous three months, marking every case where a doji, engulfing, or hammer appeared at or near a significant support or resistance level. He found eleven cases. For each, he noted the trend, whether the level was significant, and what price did over the following five sessions.
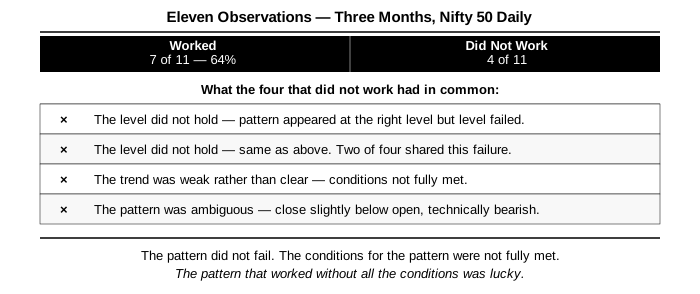
Seven of the eleven moved in the direction the pattern suggested. Four did not.
He brought this to KM Sir.
"Seven out of eleven," KM Sir said. "Sixty-four percent." He looked at the four that hadn't worked. "What did these four have in common?"
Rohan looked at them. Two had shown up at levels that had already been broken and then retested. The pattern appeared at the right level, but the level itself didn't hold. One had appeared at a level that did hold, but the trend had been weak rather than clear. One was a borderline case --- close to a doji, but the close was slightly below the open, making it technically bearish.
"The level didn't hold in two cases. The trend was unclear in one. The pattern was ambiguous in one," Rohan said.
"Yes. So the pattern didn't fail. The conditions for the pattern weren't fully met." This distinction --- between a pattern failing and the conditions for the pattern simply not being there --- was one he would carry forward.
The exercise for this chapter was about watching, not acting.
For two weeks, Rohan opened the Nifty 50 and Bank Nifty daily charts every evening and noted any of the three patterns that had appeared in the last three sessions. He didn't trade on any of them. He just noted them, then checked the following evening to see what price had done.
By the end of two weeks he had logged fourteen observations. Ten had moved in the direction the pattern suggested. Four had not.
He looked at the four that hadn't worked and asked the same question KM Sir had asked: what was different about them? Three of the four had appeared with no significant level nearby. One had appeared against the trend.
A pattern that worked without all the conditions in place was luck. A pattern that worked with all the conditions in place was a system.
He closed the browser tab with the forty-seven patterns for the last time. He kept the page with the three patterns and the questions he'd learned to ask before looking at them. That page stayed in his notebook until the binding wore through, and he carried it forward into the next notebook, then the next.