Support and Resistance --- The Market's Memory
The following Wednesday morning, Rohan drew his first support level.
He was at his desk in Andheri at 8:45am, laptop open to TradingView, Kite on his phone. He had followed KM Sir's instruction for five days --- looking at charts with no indicators, just price. He had started to notice things in the price he had never seen before. Places where the price had stopped falling. Places where it hit the same level twice and turned around. He had written some of these observations in the notebook he'd bought on Monday, not sure why he was writing them down, just feeling that they should be recorded.
He drew a horizontal line on the chart at a level where the price had bounced three times in the last two months. The line was at ₹19,200 on the Nifty 50.
He drew it with confidence. Then he looked at what he had drawn.
He had seventeen other lines on the chart.
Three days earlier, he had found a YouTube video on support and resistance levels. It explained the concept well enough, but it also showed charts covered in horizontal lines at every point where price had ever paused. The creator had drawn what looked like a dozen levels on a single chart and called all of them important. Rohan had copied this faithfully.
The result was a chart that looked like a musical staff with too many lines on it. Stare at it long enough and every price point seemed close to a level. Which meant nothing was near a level in any meaningful sense --- the whole idea only worked if the levels were specific.
He called Meera that evening.
Meera Nair was someone he had known since their college orientation week --- a developer in Pune who had been trading on and off for two years. She wasn't, she had told him once, a good trader. She was, however, an honest one, which Rohan had come to understand was rarer than being a good one.
"I drew seventeen support and resistance levels on one chart," he said.
"Are they all support and resistance?"
"I have no idea. They could be. They're all places where price stopped at some point."
There was a pause. "Why does price stop at round numbers?" Meera asked. "I've noticed it always stops at levels like 19,000 or 20,000 or 19,500. Is that real or am I making it up?"
Rohan didn't know. He wrote the question in his notebook.
He asked KM Sir about it on Sunday.
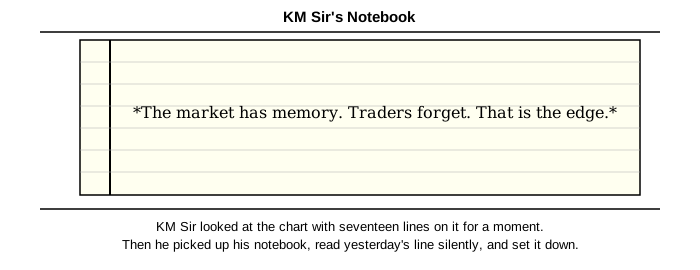
KM Sir looked at the chart with seventeen lines on it for a moment. Then he picked up his notebook, read yesterday's line silently, and set it down.
*The market has memory. Traders forget. That is the edge.*
"How many of these lines would you say are important?" KM Sir asked.
"All of them?"
"If all of them are important, none of them are important. A level is important when the price has behaved specifically and repeatedly at that price. Not once. Not vaguely. Specifically and repeatedly."
He picked up a pen and drew on a printed chart on his table --- he kept charts printed on paper for note-taking, which Rohan found both old-fashioned and oddly reassuring.
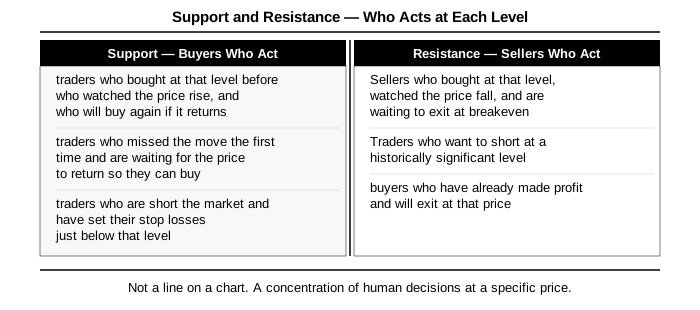
"A support level is a price at which buyers have shown up enough times that the price has stopped falling and turned around. Here's the logic: there are traders who bought at that level before, watched the price rise, and will buy again if it returns --- because it proved them right last time. There are other traders who missed the move the first time and are waiting for the price to come back so they can buy. And there are traders who are short the market and have set their stop losses just below that level."
He paused.
"When all of these people act at the same level, the price stops. That is support. Not a line on a chart. A pile-up of human decisions at a specific price."
Rohan thought about this. "And resistance is the same thing but with sellers?"
"Yes. Sellers who bought at that level, watched the price fall, and are waiting to exit at breakeven. Traders who want to short at a historically significant level. And buyers who have already made profit and will exit at that price."
"So the round numbers --- 19,000, 20,000 --- those are support and resistance because everyone can see them, so everyone acts at them?"
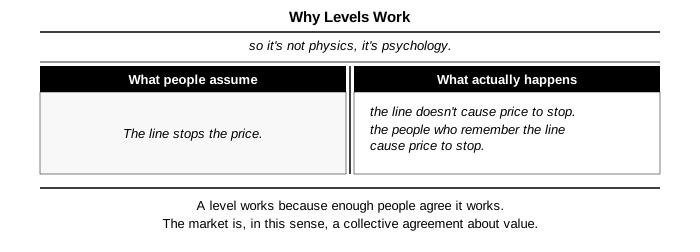
"Exactly. A level works because enough people agree it works. In that sense, the market is a collective agreement about value."
He sent this explanation to Meera that evening. She replied: so it's not physics, it's psychology.
He replied: yes. the line doesn't cause price to stop. the people who remember the line cause price to stop.
She replied: that's the most useful thing anyone has told me about trading.
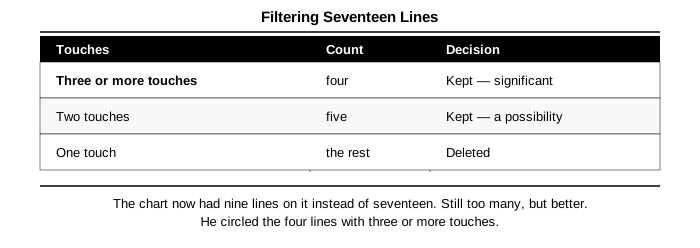
The practical rule, as KM Sir explained it, was this: a significant level needed at least three touches --- three times the price had reached that point and reacted to it. Two touches was a maybe. One touch wasn't a level at all. It was just a point on a chart.
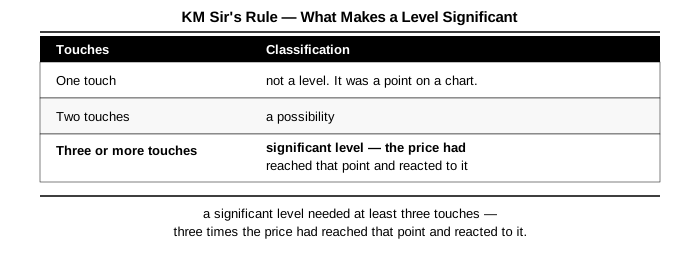
Rohan went back to his chart and looked at it through this filter. Of the seventeen lines he had drawn, four had three or more touches. Five had two. The rest had one.
He deleted the lines with one touch. He kept the rest.
The chart now had nine lines instead of seventeen. Still too many, but better.
He looked at the four lines with three or more touches. These were the ones KM Sir would consider significant. He circled them.
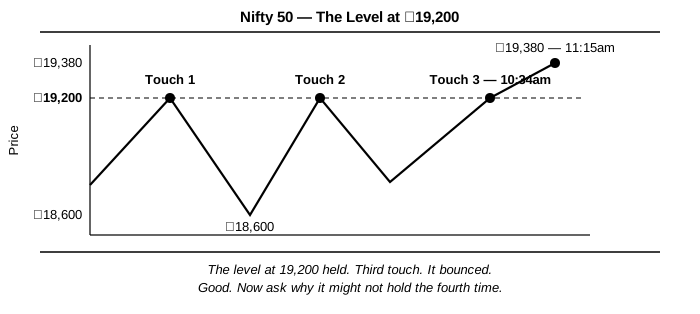
The line at ₹19,200 was one of them. The price had touched it in August, been rejected, fallen to ₹18,600, risen back to ₹19,200, been rejected again, fallen again, and was now approaching it a third time.
Rohan looked at that level for a long time. Then he opened a new page in his notebook and wrote: The market remembers this level. The question is: what will it do when it gets there?
He photographed the chart before the price moved away, as if the chart might change its mind.
He didn't trade. Not yet. He had learned from Chapter 1 what happened when he acted before he understood. He had paid ₹40,247 for that lesson. He wasn't going to pay for it twice.
The following Thursday, the Nifty 50 touched ₹19,200 for the third time and bounced.
Rohan was in the bathroom at work when it happened --- a different trip to the bathroom than the one in October, for a very different reason. He wasn't checking losses. He was watching a level he had drawn.
The price touched ₹19,200 at 10:34am and reversed. By 11:15am it was at ₹19,380.
He hadn't placed a trade. He had drawn the level, watched the level, and seen it work exactly as it was supposed to.
Something shifted in how he understood what he was learning. This wasn't theory. It was a prediction --- a real, specific prediction, based on something he could see on a chart --- and it had worked.
He texted KM Sir that evening: The level at 19,200 held. Third touch. It bounced.
KM Sir replied twelve minutes later: Good. Now ask why it might not hold the fourth time.
Rohan stared at this reply for a moment. He hadn't considered that.
He wrote it in his notebook: The market has memory. But memory is not certainty.
He didn't fully understand why he wrote it. He would understand it better by Chapter 8, and fully understand it only after the losses in Chapter 9. For now, it was just a sentence that felt true.
The practical question he spent the second week working on wasn't whether support and resistance existed --- he had already seen it work at ₹19,200. The real question was: how do you find the levels that matter?
The wrong approach --- which he had already tried --- was to mark every place the price had ever paused. That just produced noise. Every price had paused somewhere. The question was which pauses actually meant something.
KM Sir's rule of three touches was the starting filter. But it left a further question open: three touches at a level told you the level had mattered in the past. It didn't tell you the level was still active. A level that had been significant eighteen months ago, and broken several times since, wasn't the same as a level touched three times in the last eight weeks.
He began to think about levels the way he thought about memory in software. A cache entry accessed recently was more likely to be relevant than one untouched for months. The market's memory of a price level faded over time, especially once the price had moved a long way from it.
He started marking levels by recency: how recently had the level been tested? How far had price moved away from it since? Had the level been broken and then reclaimed, or had it held cleanly every time?
The idea KM Sir introduced on the third Sunday changed how Rohan thought about levels for good: the flip.
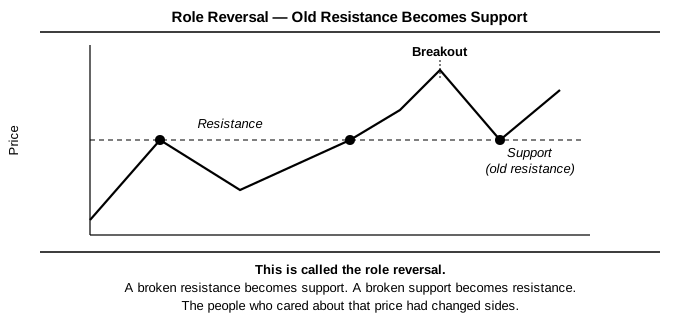
"When a resistance level is broken convincingly," KM Sir said, "what happens to it?"
Rohan thought about it. "It... becomes support?"
"Why?"
He worked through the logic. When a resistance level existed, there were traders waiting to sell at that level --- people who had bought below it and wanted to exit at breakeven, and people who believed the level was a ceiling. When the price broke above the level with enough force, those sellers got overwhelmed. Their positions were absorbed. They were either stopped out or had already gotten out.
Now the old resistance level was where the buyers who drove the breakout had entered. Those buyers were now in profit and unlikely to sell right away. If the price pulled back to that level, those buyers were likely to buy more --- defending their position. And traders who had watched the breakout and missed it were now waiting for price to return to that level so they could get in.
The level that used to be resistance had become support, because the people who cared about that price had switched sides.
"This is called the role reversal," KM Sir said. "A broken resistance becomes support. A broken support becomes resistance. This is one of the most reliable things in technical analysis, because it isn't based on mathematics or algorithms. It's based on human psychology and financial self-interest, and those don't change."
The exercise for this chapter was one Rohan would keep doing every weekend for the next two years.
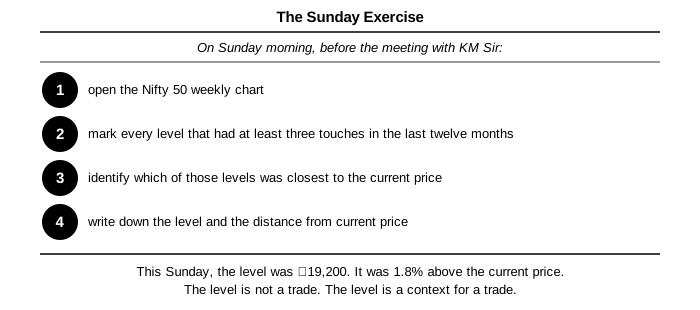
On Sunday morning, before the meeting with KM Sir, he would open the Nifty 50 weekly chart and mark every level with at least three touches in the last twelve months. He would then find which of those levels was closest to the current price, and write down the level and the distance from where price was now.
This Sunday, the level was ₹19,200 --- the same level he had drawn seventeen days earlier. It was 1.8% above the current price.
He carried this into the meeting and out of it. He didn't trade off it that day. He wrote in his notebook: The level is not a trade. The level is a context for a trade.
He didn't fully understand this sentence. He had been writing sentences he didn't fully understand for four weeks now, on the theory that they would become clear eventually. This one became clear in Chapter 5, when he understood that the level was only the start --- what happened at the level, confirmed by other information, was where the trade actually lived.
That Wednesday, when the Nifty touched ₹19,200 for the third time and bounced, he didn't trade. He watched. He noted the volume on the bounce candle. He checked whether the candle that closed on the bounce was bullish or bearish. He checked whether the MACD was converging or diverging.
He did none of this systematically, or even all that well. He was still learning to see. But he was learning to look at a level and ask questions, instead of buying the moment it was touched.
That was the real progress of Chapter 3. Not finding the level. Learning to wait at it.