EMA + MACD --- Rohan's First System
On the first Sunday of December, at 6:12am, Rohan sat at his desk in Malad with his laptop open and a cup of chai gone cold beside him.
He had been awake since 5:30am. Not from anxiety, for once, but from something closer to readiness. He had been building toward this for six weeks. He had learned to read price. He had learned support and resistance. He had learned candlestick signals. He had learned volume. He had learned trends. He had learned to filter everything through moving averages.
He had all the pieces. What he hadn't done yet was put them together into a rule he could follow every single time, without exception, and without improvising off some feeling he couldn't name.
That morning, before KM Sir's weekly session, he was going to build his system.
The system had to answer three questions before any trade.
The first question: What is the trend? He had learned this in Chapter 6. The answer came from the 50 EMA. If price was above the 50 EMA and the 50 EMA was sloping upward, the trend was up. If price was below the 50 EMA and the 50 EMA was sloping downward, the trend was down. If neither was clear, the market was ranging, and he wouldn't trade.
The second question: Is there a signal in the direction of the trend? He'd been wrestling with this for a week. He needed a way to spot when a trade opportunity had shown up in the direction of the trend. Candlestick signals alone had proved inconsistent in real time. He needed something more systematic.
He had spent the previous four days reading about the MACD.
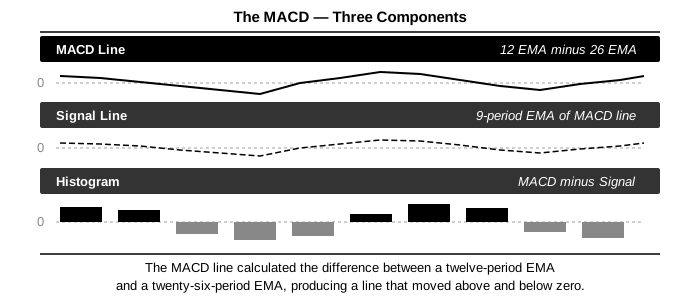
The MACD --- Moving Average Convergence Divergence --- was invented in the 1970s by Gerald Appel, and it had been one of the most widely used momentum indicators ever since. It calculated the difference between a twelve-period EMA and a twenty-six-period EMA, producing a line that moved above and below zero. A second line --- the signal line --- was a nine-period EMA of the MACD line itself. The histogram showed the gap between the two lines.
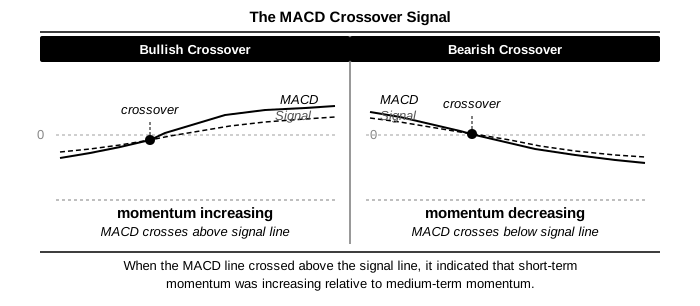
The crossover that mattered was this: when the MACD line crossed above the signal line, short-term momentum was picking up relative to medium-term momentum. When it crossed below, the opposite. In a trending market, a MACD crossover in the direction of the trend signaled the trend was continuing with fresh momentum.
This was the signal he needed.
He wrote his system on a page in his notebook:
Rule 1: The 50 EMA must confirm the trend. Price above 50 EMA, 50 EMA sloping up = uptrend. Trade long only. Price below 50 EMA, 50 EMA sloping down = downtrend. Trade short only. Neither = no trade.
Rule 2: The MACD must cross in the direction of the trend. Long trade: MACD line crosses above signal line. Short trade: MACD line crosses below signal line.
Rule 3: Volume on the signal candle must be above the 20-period average. Low volume signals are not traded.
Stop loss: below the most recent swing low for long trades. Above the most recent swing high for short trades.
No exceptions.
He underlined "No exceptions" twice.
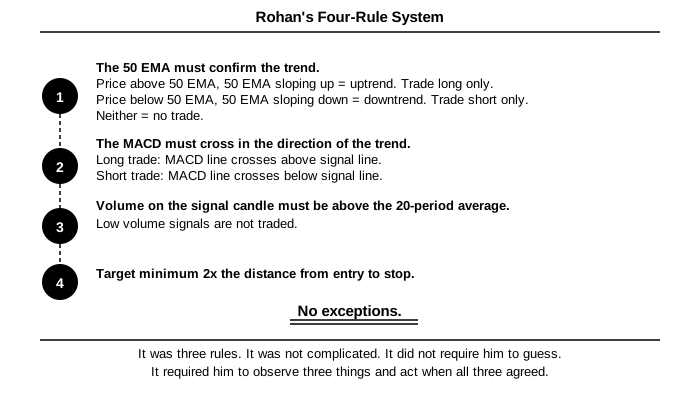
He sat back and looked at what he had written. Three rules. Nothing complicated. It didn't ask him to guess. It asked him to check three things and act only when all three agreed.
He brought it to KM Sir at 9am.
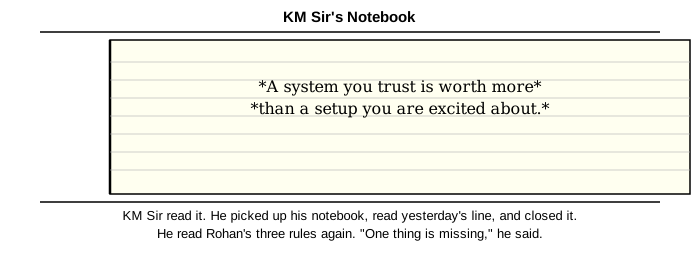
KM Sir read it. He picked up his notebook, read yesterday's line, and closed it.
*A system you trust is worth more than a setup you are excited about.*
He read Rohan's three rules again.
"One thing is missing," he said.
"The target," Rohan said. He had already known this.
"Yes. What is your exit?"
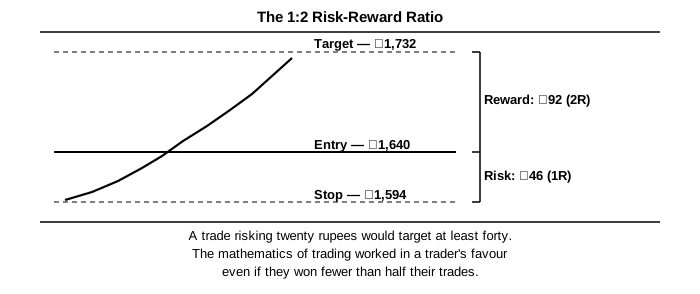
They spent twenty minutes on exits. The rule they landed on: set the target at a minimum of twice the distance from entry to stop. A trade risking twenty rupees should target at least forty. This was the 1:2 risk-reward ratio --- the minimum at which the math of trading works in your favour even if you win fewer than half your trades.
Rohan added it to his notebook as Rule 4: Target minimum 2x the distance from entry to stop.
KM Sir looked at the four rules. "Now backtest it," he said. "Before you trade it live, go back over the last three months of any chart you'd trade and count how many times these four conditions showed up together. Count how many of those would have been profitable if you'd followed all four rules. Count how many would have been losses."
"How do I know if the system is good?"
"You look at the results. If the system produced profitable trades more than fifty percent of the time at 1:2 risk-reward, the math works in your favour with consistent use. Below fifty percent, you need to check whether your test period had unusual market conditions, or whether the system has a real problem."
Rohan spent the following week going through three months of Nifty 50 daily charts, marking every point where his four rules lined up.
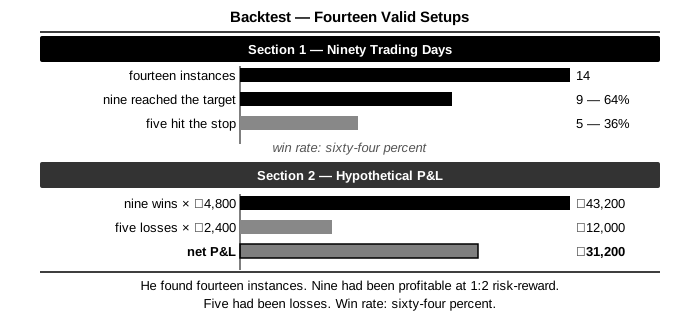
He found fourteen instances. Nine would have been profitable at 1:2 risk-reward. Five would have been losses. Win rate: sixty-four percent. His potential P&L for the period, trading one standard lot, would have been solidly positive.
The first live trade using the system came eleven days later.
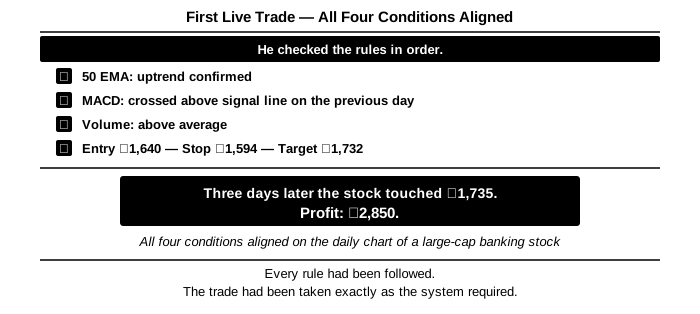
All four conditions lined up on the daily chart of a large-cap banking stock in the Nifty Bank index. He checked the rules in order. 50 EMA: uptrend confirmed. MACD: crossed above the signal line the day before. Volume: above average. He set his entry at the market open, his stop below the previous swing low, and his target at twice the stop distance.
He entered at ₹1,640. Stop: ₹1,594. Target: ₹1,732.
Three days later the stock touched ₹1,735 and he closed the trade.
Profit: ₹2,850.
The trade worked, and he felt nothing except the urge to check whether he had followed all four rules correctly.
He checked. He had. Every rule had been followed. The trade had been taken exactly as the system required.
He didn't yet know whether this meant the system was good. One trade proved nothing --- he had been told this. But the feeling was different from any trade he had won before. His earlier wins had felt like luck. This one felt like the execution of a plan.
Three weeks after building the system, the Nifty 50 went sideways.
For eleven straight trading days, the index moved between ₹19,600 and ₹20,100 with no clear direction. The 50 EMA flattened. The MACD crossed above and below the signal line three times in nine days. Each time it crossed, Rohan checked Rule 1: was the 50 EMA confirming a clear trend?
It wasn't. The 50 EMA was flat. The market was ranging.
Rule 1 said: ranging market, no trade. He didn't trade for eleven days.
On the twelfth day, the market broke higher on above-average volume. The 50 EMA began sloping upward again. The MACD crossed above the signal line. Volume confirmed it. All four rules lined up.
He entered.
The trade was a loss. The breakout failed. He was stopped out at a loss of ₹2,100.
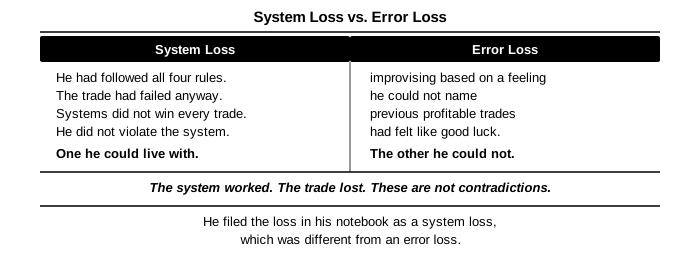
He looked at the trade afterward. He had followed all four rules. The trade had failed anyway.
He had known, intellectually, that this would happen. Systems don't win every trade. A sixty-four percent win rate from his backtest meant thirty-six percent of trades were losses. He had known the number. He just hadn't felt it yet.
He wrote in his notebook: The system worked. The trade lost. These are not contradictions.
This turned out to be the most important sentence he would write in all of Book 1. He didn't know that yet. He would only fully understand it after Chapter 9.
The backtesting process turned out to be slower and more manual than he expected.
He had assumed backtesting meant running a program. It didn't --- not yet. He didn't have the programming skills to automate a backtest of a discretionary system, and by now he had also learned to be suspicious of automated backtests he didn't fully understand. The first backtest, KM Sir had told him, should always be manual: go through the chart bar by bar, apply the rules as if seeing each candle for the first time, and record what the rules would have produced.
He set aside all of Saturday afternoon.
He printed out a copy of the Nifty 50 daily chart for the previous ninety trading days. He covered everything after day one with a piece of paper and moved it forward one day at a time, asking the four questions at each new candle.
Rule 1: Is the 50 EMA confirming a clear trend? He drew the 50 EMA on his printed chart in pencil. For the first twenty days, the EMA was still sloping upward, so any signal in that stretch was a long signal. For the next thirty days, the EMA flattened and then started sloping downward, which changed what counted as a valid signal.
Rule 2: Has the MACD crossed in the direction of the trend? He marked every MACD crossover on the chart in red (bearish) and blue (bullish). In the trending phases, some crossovers were usable. In the flat phase, some crossovers would have been false signals --- ones the EMA filter would have screened out.
Rule 3: Is volume above the twenty-period average on the signal candle? He calculated the twenty-period average volume for each candle and marked each crossover valid or invalid based on volume.
The process took three hours.
He found fourteen valid setups. Not thirty. Not fifty. Fourteen, across ninety trading days, where all four conditions lined up. Roughly one setup every six days.
Of the fourteen, he traced what would have happened if he had entered on the open of the next candle, with a stop below the recent swing low and a target at twice the stop distance.
Nine had reached the target. Five had hit the stop.
He worked out the net P&L. Using a hypothetical position of fifty shares at an entry price of around ₹19,000, each winning trade would have made roughly ₹4,800 (fifty shares × a target distance of about ₹96). Each losing trade would have cost roughly ₹2,400 (fifty shares × a stop distance of about ₹48).
Net hypothetical P&L: nine wins × ₹4,800, minus five losses × ₹2,400. ₹43,200 minus ₹12,000. Net ₹31,200 on a hypothetical account.
He stared at this number. He had lost ₹40,247 in his first month. If he'd been trading this system instead, over the same ninety days, he would have come out ahead.
He didn't let himself get too excited. A backtest isn't the same as live trading. Stops wouldn't always fill at the exact price. Entries wouldn't always be available at the level he expected. His judgment on EMA direction and MACD validity would vary from one reading to the next. He'd been warned about all of this. But the math of the system, even applied imperfectly, seemed to work.
The eleven sideways days taught him something the backtest hadn't.
In a backtest, a sideways stretch shows up as a flat band on the chart. You can see it from above, and you can see where it ends. In real time, you can't. He knew the market had been sideways for eight days. He didn't know if it would stay that way for two more days, or twenty.
Rule 1 --- no trade unless the 50 EMA confirms a clear trend --- had been built exactly for this situation. But applying it took judgment. The EMA was flattening. Was it flat enough to call the trend unclear? Was this a pause before the trend continued, or the start of a range?
He asked KM Sir.
"You will not always know the answer to that question," KM Sir said. "When you're unsure whether the 50 EMA is trending or ranging, the default is to wait. The cost of waiting is missing a trade. The cost of entering a ranging market with a trend-following system is a string of false signals and a string of losses. The cost of waiting is lower."
"But in real time, it feels like missing an opportunity," Rohan said.
"Yes. That feeling never goes away. You learn to value the system's protection more than the feeling of having missed something."
He waited out the sideways market. He got stopped out on the first trade after it ended. He didn't break the system. He filed the loss in his notebook as a system loss, which was different from an error loss. One he could live with. The other, he couldn't.