What a Chart Is Actually Telling You
KM Sir's flat in Chembur was smaller than Rohan had expected. It was a narrow building on a lane off Sion-Trombay Road, three floors up --- the kind of building where the lift worked when it felt like it, but the stairs always worked. The front door opened into a room that served as both living room and study: two chairs facing each other across a low table, bookshelves along one wall, a laptop and a stack of papers on the table, and a glass of filter coffee on the side that was clearly KM Sir's.
KM Sir was fifty-two and looked like someone who had spent a long time paying attention to things. He had a kind of stillness that didn't come from being slow, but from having decided, at some point, that most movement is unnecessary. He shook Rohan's hand, gestured to the other chair, and said nothing until Rohan had sat down.
"Open your laptop," he said. "And show me a chart."
Rohan opened Kite. He pulled up a chart of the mid-cap IT company he had lost ₹12,400 on during earnings. He turned the laptop toward KM Sir.
"What does this chart show you?" KM Sir asked.
Rohan looked at the chart. He had been looking at charts every day for a month. He said what the Telegram group would have said: "It's been in a downtrend since the results. The RSI is oversold. There might be a bounce from this level."
KM Sir looked at the chart for a moment. Then he looked at Rohan.
"What is the chart actually showing you?" he said.
Rohan looked at the chart again. He didn't know how to answer differently.
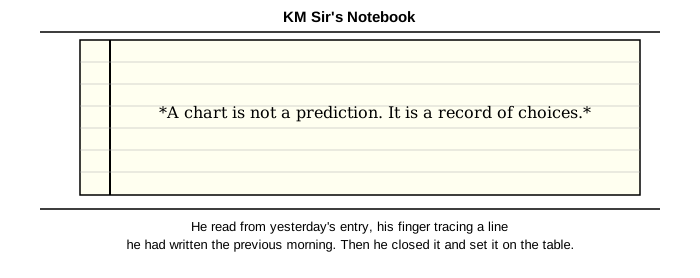
KM Sir picked up his notebook from the table --- a worn leather-covered notebook with a cloth bookmark --- and opened it. He read from yesterday's entry, his finger tracing a line he had written the previous morning. Then he closed it and set it on the table.
*A chart is not a prediction. It is a record of choices.*
"Every point on that chart," he said, "is a trade that actually happened. Someone decided to sell at that price. Someone else decided to buy at that price. They agreed. The transaction happened. The chart recorded it. That is all the chart is: a record of the prices at which willing buyers and willing sellers agreed to exchange shares."
Rohan looked at the chart again. He had never thought about it this way.
He had been staring at charts for thirty days, and this was the first time he had actually looked at one.
KM Sir spent the next hour explaining what a candlestick chart contained --- not the patterns or the signals, but the raw data.
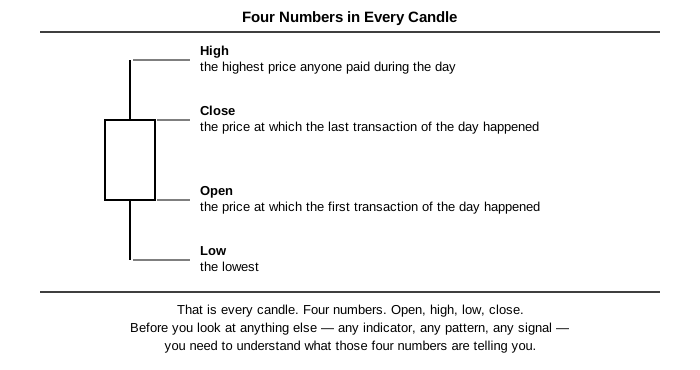
Each candle represented a time period. On a daily chart, each candle was one trading day. The candle had four numbers: the open, the high, the low, and the close. The open was the price at which the first transaction of the day happened. The close was the price at which the last transaction of the day happened. The high was the highest price anyone paid during the day. The low was the lowest.
"That is every candle," KM Sir said. "Four numbers. Open, high, low, close. Before you look at anything else --- any indicator, any pattern, any signal --- you need to understand what those four numbers are telling you."
He leaned forward and pointed to a candle on the chart where the close was well below the open.
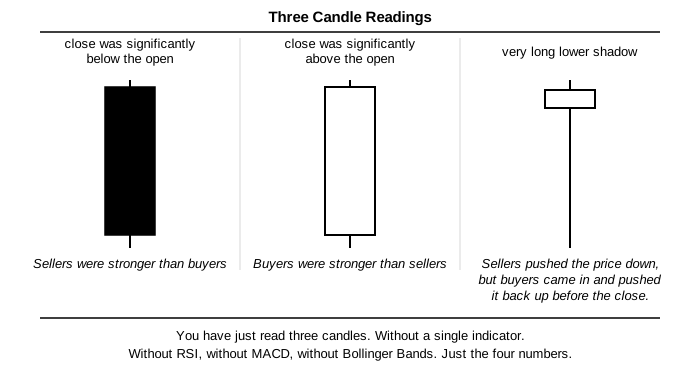
"This day, the price opened here and closed here. What does that tell you?"
"Sellers were stronger than buyers," Rohan said.
"Yes. And this one?" He pointed to a candle where the close was well above the open.
"Buyers were stronger than sellers."
"And this one?" A candle with a very long lower shadow --- the price had dropped a lot during the day, then recovered and closed near the top.
Rohan thought about it. "Sellers pushed the price down, but buyers came in and pushed it back up before the close."
"Exactly." KM Sir sat back. "You have just read three candles. Without a single indicator. Without RSI, without MACD, without Bollinger Bands. Just the four numbers."
They spent the next thirty minutes on timeframes.
This was something Rohan had never considered. He had been looking at whatever chart Kite showed him by default, which happened to be a fifteen-minute intraday chart. He hadn't thought about what that meant.
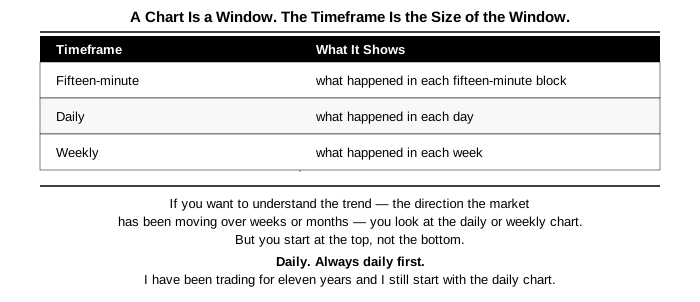
KM Sir explained it like this: a chart is a window. The timeframe is the size of the window. A fifteen-minute chart shows you what happened in each fifteen-minute block. A daily chart shows you what happened in each day. A weekly chart shows you what happened in each week.
"If you want to understand the trend --- the direction the market has been moving over weeks or months --- you look at the daily or weekly chart. If you want to find your entry for a trade you will hold for a few days, you look at the daily chart. If you are already convinced about the trade and you want to choose the exact moment to enter, you look at a shorter chart. But you start at the top, not the bottom."
"What did you start with?" Rohan asked.
"Daily. Always daily first. I have been trading for eleven years and I still start with the daily chart."
Rohan thought about the fact that he had spent a month staring at fifteen-minute charts of stocks he had found in Telegram groups.
He didn't say this out loud. KM Sir didn't ask.
Before Rohan left, KM Sir gave him one instruction.
"For the next seven days, look at charts. Just the price. No indicators. No RSI, no MACD, no moving averages. Turn them all off. Every morning, open the Nifty 50 daily chart and look at the last sixty candles. Ask yourself one question: what has this price been doing? Not what will it do. What has it done."
"That's it?"
"For this week, yes. That is enough."
Rohan wanted to ask about the RSI. He wanted to ask when to add indicators back. He wanted to ask about the trade he had lost ₹12,400 on and whether he could have avoided it. He didn't ask any of it, because KM Sir had already picked up his notebook and was reading, and the conversation had clearly ended.
The filter coffee on KM Sir's side of the table had gone cold during the lesson. KM Sir hadn't touched it.
On the train back to Malad, Rohan opened the Kite app. He pulled up the Nifty 50 daily chart and removed every indicator, one by one, until only the candlesticks remained on a plain background.
He looked at the chart for a long time.
The price had been falling for three weeks, then stabilising, then rising slowly for the last few days. He could see that clearly now. He hadn't been able to see it before, because the chart had been covered in lines and histograms. Without all of that, the story was simple: down, then sideways, then cautiously up.
He saved the chart view and closed the app.
He had one question he hadn't asked: why hadn't he been able to see this before? The answer, he was beginning to suspect, was that he had been looking for complexity because he assumed the market required it. Vikram's ₹60,000 hadn't looked like something a simple idea could produce.
It occurred to him now that he didn't actually know how Vikram had made that money. He had assumed it was sophistication. He had no evidence for that assumption.
The train arrived at Malad station. He walked to his flat, made a cup of chai, and opened the Nifty 50 daily chart again.
He looked at it for one hour. He didn't trade.
This was the most productive hour of his trading education.
The seven days KM Sir had given him turned into a lesson in how much he had been ignoring.
He had been using TradingView for five weeks. In those five weeks he had added fourteen different indicators, each one promising a clearer signal. In all that time, he had never once simply looked at the price moving without an indicator beneath it, beside it, or laid over it. The price had always come with company. It had never been allowed to speak for itself.
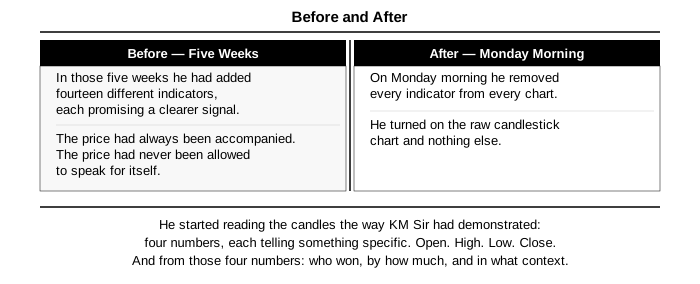
On Monday morning he removed every indicator from every chart. He switched on the raw candlestick chart and nothing else. He looked at the Nifty 50 daily chart for the previous sixty trading days.
For the first ten minutes, he felt blind. He kept instinctively looking for the RSI panel below the chart that no longer existed. He kept reaching for a moving average line to orient himself, and finding only the raw price.
Then something shifted. He started reading the candles the way KM Sir had shown him: four numbers, each telling him something specific. Open. High. Low. Close. And from those four numbers: who won, by how much, and in what context.
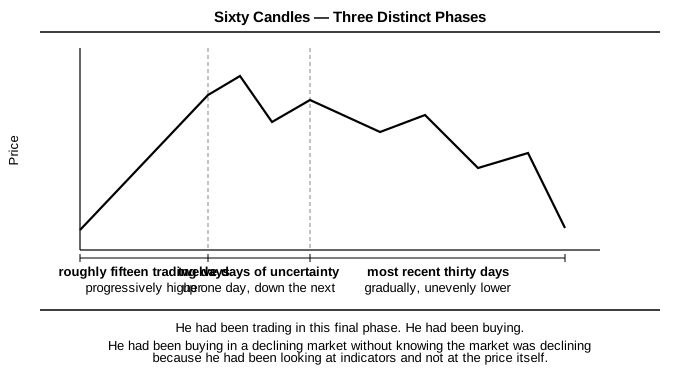
Looking at the sixty candles, he could see three distinct phases. First, about fifteen trading days where the daily closes had climbed steadily, each day's close above the one before it. Then twelve days of uncertainty --- up one day, down the next, no clear direction. Then the most recent thirty days, gradually and unevenly lower.
He had been trading in this final phase. He had been buying.
He had been buying into a falling market without even knowing it was falling, because he had been looking at indicators instead of the price itself.
By day three of the exercise, he brought KM Sir a question he hadn't expected to have: what was he actually looking for when he read price?
He messaged KM Sir --- not a call, since KM Sir preferred messages to calls during the week. He wrote: I'm looking at the Nifty daily chart with no indicators. I can see the direction has changed. But I don't know what I'm looking for specifically. What is the question I should be asking when I look at a chart?
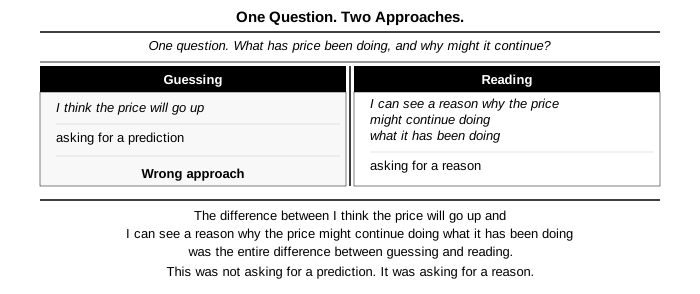
The reply came ninety minutes later: One question. What has price been doing, and why might it continue?
Rohan read this three times. The second half --- why might it continue --- was what stuck with him for the rest of the day. This wasn't asking for a prediction. It was asking for a reason. The difference between I think the price will go up and I can see a reason why the price might continue doing what it has been doing was the whole difference between guessing and reading.
He looked at the chart again. The price had been falling for thirty days. The reason it might continue was that each rally had been weaker than the last --- each bounce had reached a lower high than the one before it. There was no structural reason visible in the price itself for the decline to end.
He wrote this in his notebook. It was the first trade-related observation he had made that came entirely from what he could see in the price, with no input from any outside source.
By the fifth day of the exercise, he had built a habit he would keep, in some form, for years.
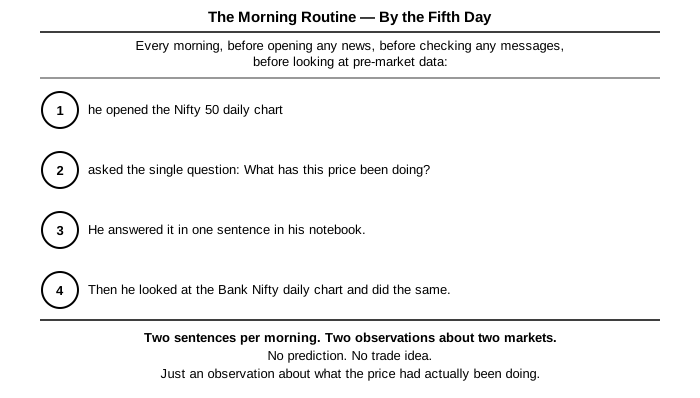
Every morning, before opening any news, before checking any messages, before looking at pre-market data, he opened the Nifty 50 daily chart and asked one question: What has this price been doing? He answered it in one sentence in his notebook. Then he opened the Bank Nifty daily chart and did the same.
Two sentences a morning. Two observations about two markets. No prediction. No trade idea. Just an observation about what the price had actually been doing.
On the sixth day, he compared his six sentences about the Nifty 50 to what the price had actually done. Five of his six sentences accurately matched how the price had behaved in the session that followed. Not predicted --- matched. He had looked at the chart and described its behaviour correctly more often than not.
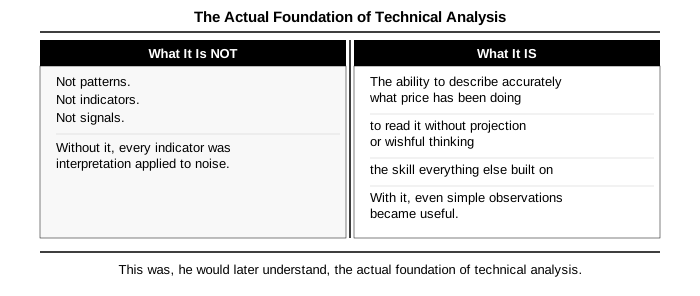
This was, he would later understand, the real foundation of technical analysis. Not patterns. Not indicators. Not signals. The ability to describe accurately what price has been doing --- to read it without projection or wishful thinking --- was the skill everything else was built on. Without it, every indicator was just interpretation applied to noise. With it, even simple observations became useful.
He sent KM Sir the observation on day six. KM Sir replied: Good. Now add one more question: at what level has the price found support or resistance? That is next Sunday.